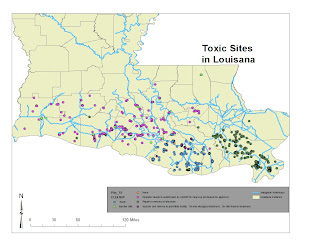
Map 9a - Joins
Map 9b - Relates
Wednesday, October 26, 2011
Sunday, October 23, 2011
Lab 7 - Data Acquisition and Management
Map 1 - Features of Illinois
Screen Shot from Arc Catalog for Map 1
Map 2 - Illinois Wetlands
Screen Shot from Arc Catalog for Map 2
Map 3- Census Data
This third map makes no logical sense. I symbolized the data that was available to demonstrate if the data had population numbers I would know how to properly symbolize it. Also, the scale on this map is not accurate.
Thursday, October 13, 2011
Lab #6 Cartography
Map 18a
Map 18b
Map 18b Altered
Map 18c
Map 19a
Map 19a Altered
Map 19b
Map 19b Altered
Map 19c
Map 19d
Map 18b
Map 18b Altered
Map 18c
Map 19a
Map 19a Altered
Map 19b
Map 19b Altered
Map 19c
Map 19d
Tuesday, October 4, 2011
Lab #5 Symbolization & Classification
Map 5a
Map 5a altered
Map 5b
Map 5c
Map 5d
Map 5d altered
Map 6a
Map 6a altered
Map 6b
Map 6c
Map 6c altered
Map 6d
Map 5a altered
Map 5b
Map 5c
Map 5d
Map 5d altered
Map 6a
Map 6a altered
Map 6b
Map 6c
Map 6c altered
Map 6d
Subscribe to:
Comments (Atom)


